
Armor Pro Research · ENSO companion
El Niño, La Niña, and U.S. Hurricane Landfalls, 1950-2025
The classic 1998 result revisited with 28 more seasons and NOAA's new index. La Niña seasons have brought twice the U.S. hurricane landfalls of El Niño seasons, and 2026 is developing as a strong El Niño season.
This page is the ENSO section of Where Do Hurricanes Make Landfall Most Often in the U.S.? The 2026 Answer, at full depth. The Pacific sets the odds for the Atlantic. That has been known since William Gray connected El Niño to Atlantic hurricane activity in 1984, and it has been quantified for U.S. landfalls since Bove and colleagues' 1998 study. This page updates that result through 2025 on the index NOAA now uses, and reads it against a 2026 season that is developing under a strong El Niño.
The result Sorting the 76 Atlantic seasons since 1950 by ENSO phase, La Niña seasons averaged 2.0 hurricane-strength U.S. landfalls, neutral seasons 1.6, and El Niño seasons 1.0. The La Niña rate is twice the El Niño rate (exact 95% confidence interval 1.1 to 3.6). Eighty-five percent of La Niña seasons had at least one U.S. hurricane landfall, against 65 percent of El Niño seasons; the chance of two or more rose from 15 to 55 percent. The 1998 study found 2.23, 1.61, and 1.04 on 1900-1997; the phase structure reproduces.
What the phases do, and why
El Niño warms the equatorial Pacific and strengthens the upper-level westerlies over the tropical Atlantic, increasing the vertical wind shear that tears developing hurricanes apart and steering the survivors toward recurvature; La Niña does the reverse. The mechanism is Gray's (1984) and it operates on the whole basin. What matters for the coast is how much of it survives to landfall.1
We classified each season by NOAA's Relative Oceanic Niño Index (RONI), the measure the Climate Prediction Center adopted for official ENSO monitoring in February 2026, using NOAA's five-consecutive-season rule and each season's August-September-October value, the peak of the hurricane season. That gives 20 El Niño, 20 La Niña, and 36 neutral seasons in 1950-2025.2 Landfalls are the strict catalog: a hurricane-strength (≥64 kt) center crossing of the continental U.S. or Florida Keys coastline.
| Phase | Seasons | U.S. hurricane landfalls | Per season | Seasons with ≥1 | Seasons with ≥2 |
|---|---|---|---|---|---|
| El Niño | 20 | 20 | 1.00 | 65% | 15% |
| Neutral | 36 | 56 | 1.56 | 75% | 44% |
| La Niña | 20 | 40 | 2.00 | 85% | 55% |
| Comparison | Rate ratio | Exact 95% CI |
|---|---|---|
| La Niña vs El Niño | 2.00 | 1.14-3.61 |
| Neutral vs El Niño | 1.56 | 0.92-2.74 |
| La Niña vs Neutral | 1.29 | 0.83-1.96 |
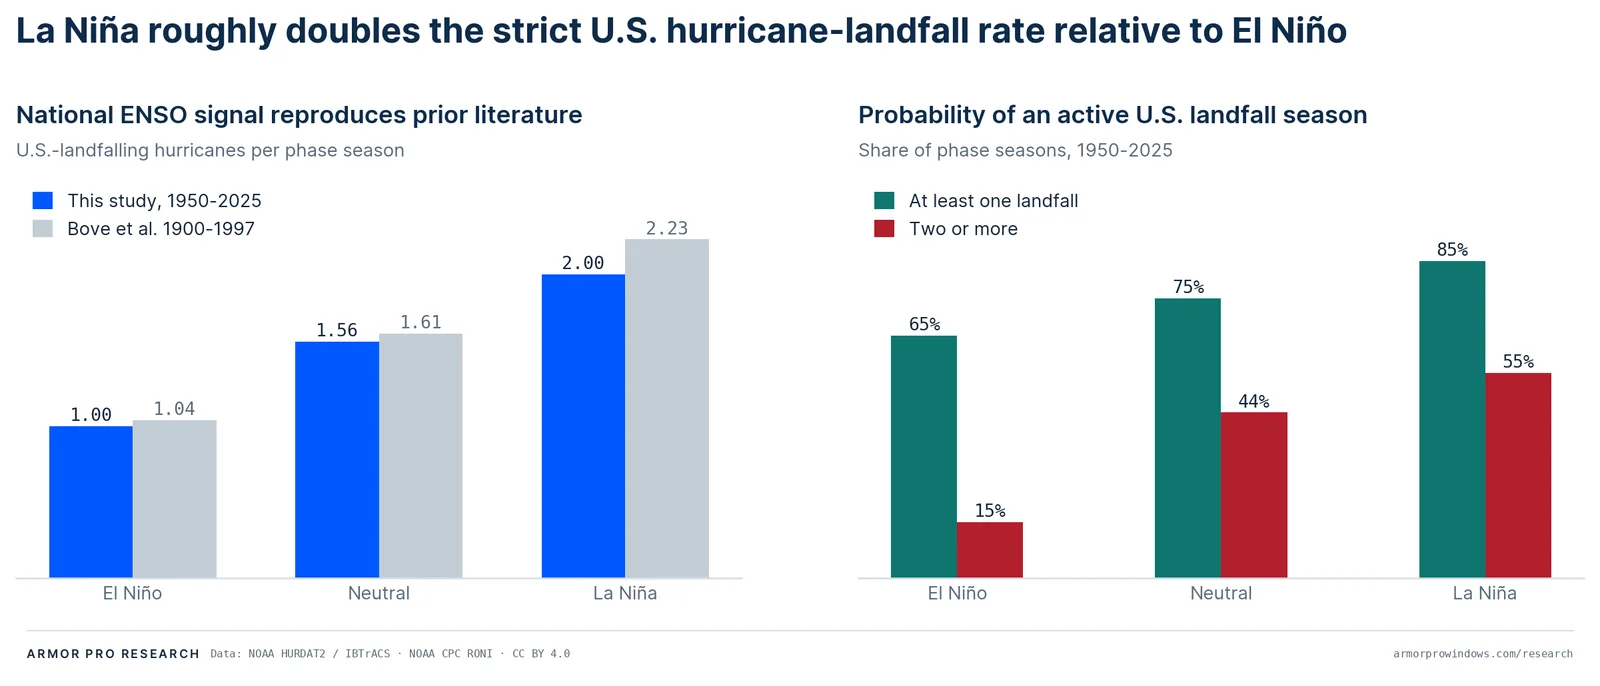
Only the La Niña-versus-El Niño comparison excludes a ratio of one; the neutral comparisons do not, and with twenty seasons in each of the outer phases the doubling is a point estimate whose interval runs from a modest elevation to a large one. It is also a statement about how many storms make landfall, not how strong the worst one is: extreme-value analysis of landfalling wind speeds finds the rarest, most intense winds if anything more likely in El Niño years.3 A homeowner should read "La Niña doubles the landfall rate" as true for frequency and silent on the worst case.
Bove et al. (1998), revisited
The 1998 study classified 1900-1997 U.S. landfalling hurricanes by ENSO phase using an SST-based index, tested each phase for Poisson dispersion, and used a bootstrap for confidence limits. Its rates were 1.04, 1.61, and 2.23 landfalls per season and its probabilities of two or more landfalls 28, 48, and 66 percent. Ours, on 1950-2025 with RONI, are 1.00, 1.56, and 2.00, and 15, 44, and 55 percent.4
| Phase | Bove et al. 1900-1997, per season | This study 1950-2025, per season | Bove et al., P(≥2) | This study, P(≥2) |
|---|---|---|---|---|
| El Niño | 1.04 | 1.00 | 28% | 15% |
| Neutral | 1.61 | 1.56 | 48% | 44% |
| La Niña | 2.23 | 2.00 | 66% | 55% |
The rates match closely; the active-season probabilities run lower for us because their event, a storm delivering hurricane-force winds to the coast, is broader than a strict center crossing. What the agreement validates is the phase partition: two different indices over different periods assign substantively the same seasons to the same phases. Smith and colleagues (2007), stratifying by region, found a La Niña-to-El Niño ratio of 2.02, closer still.5
Does El Niño change where hurricanes hit? A rate effect, not a shift
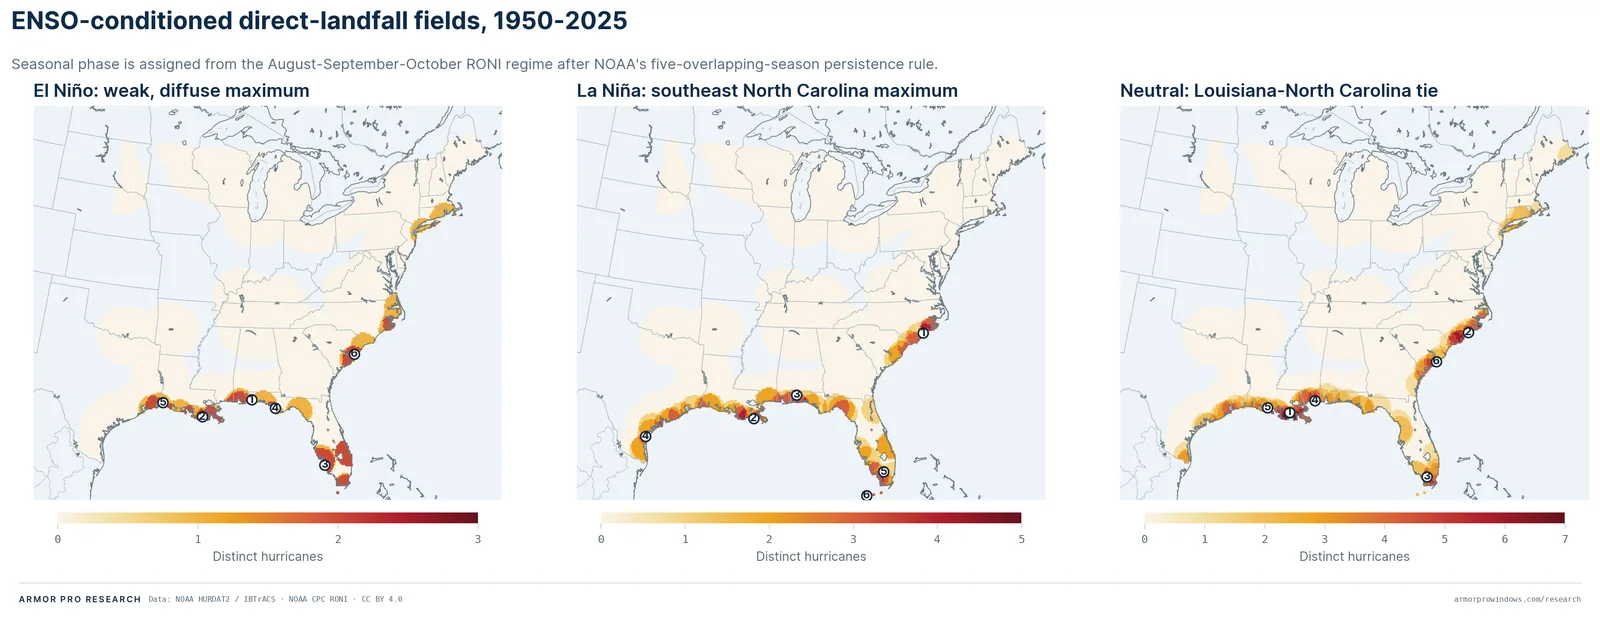
It is natural to read the maps below as three different geographies. They are not. The literature since Gray describes ENSO as changing how many storms reach the U.S. coast, not where along it they arrive: El Niño strengthens the shear that suppresses Atlantic storms and weakens the subtropical high that steers them, so a larger share of the storms that do form recurve harmlessly out to sea and a smaller share recurve into land, and La Niña does the reverse.6 The three focal points are the same in every phase. What differs is how brightly each is lit.
That dimming and brightening is not perfectly even along the coast, and the unevenness is physical rather than a relocation of hotspots. The ENSO signal is carried almost entirely by the long-track storms that form in the deep tropics and, when they reach the United States, tend to reach the East Coast; storms that form inside the Gulf of Mexico and the western Caribbean, which supply more than 40 percent of all U.S. landfalls, show no detectable ENSO dependence at all.7 The consequence, in the regional studies, is that El Niño's suppression is largest on the Florida peninsula and the East Coast and smallest on the Gulf, especially for major hurricanes, and the largest warm-versus-cold probability differences are along the East Coast and North Carolina in particular.8 Smith and colleagues, dividing the coast into three regions over 1900-2004, found La Niña-to-El Niño landfall ratios of about 1.7 for the East Coast, 2.7 for Florida, and 1.8 for the Gulf, but the only statistically significant cold-versus-neutral difference was on the East Coast; Florida's and the Gulf's were not.9
Our own maps are consistent with that. La Niña's sharpest 50-nautical-mile concentration is in southeastern North Carolina, five storms, exactly where the regional work says the modulation is strongest, and El Niño's strongest concentration anywhere is three storms in twenty seasons. But five and three are small numbers, and the right reading of a difference between two panels at this sample size is that it is mostly sampling noise on top of a real but modest regional difference in rate. Answering the phase-conditioned "where" with real confidence has required full statistical track models, and we present these maps as what they are: the same climatology counted under three labels.10
What this means for the 2026 season
The last season in our record, 2025, was a La Niña season. The season now underway is not: as of August 2026 the tropical Pacific is in moderate-to-strong El Niño conditions, and forecasters expect a strong El Niño through the peak of the season.2 The historical base rate for an El Niño season is about one hurricane-strength U.S. landfall, with roughly a 65 percent chance of at least one and a 15 percent chance of two or more, half the La Niña rate. Two things keep that from being reassuring in the wrong way. First, it is a base rate for the whole U.S. coast and not a forecast: it says nothing about which coast, and the seasonal forecasts that do attempt that, such as Colorado State University's, start from exactly this kind of climatological rate and adjust it for the season's specific conditions.11 Second, El Niño suppresses the number of landfalls, not the strength of the worst one: 2004 was an El Niño season on this index, and it brought Charley, Frances, and Jeanne ashore in Florida within 44 days; 2023 was another, and it brought Idalia to the Big Bend as a major hurricane. The two kinds of statement are meant to be read together, and neither is a prediction for any one town.
Full treatment: Section 4.5 of the report. Data: landfall_enso_aggregate.csv, enso_rate_ratios.csv, enso_phase_years_1950_2025.csv. Back to the 2026 answer.
Two caveats on the statistics
The rate-ratio intervals are exact conditional (Clopper-Pearson) intervals on the binomial split of the total count, the construction Tartaglione, Smith, and O'Brien introduced for phase-conditioned landfall counts. Season resampling and phase classification both treat seasons as exchangeable, and the ENSO signal is confounded with the Atlantic's own multidecadal variability: the La Niña elevation is carried disproportionately by seasons in the warm Atlantic phase since 1995. A covariate count model that carries both would be the natural next step; the descriptive stratification here is the field's baseline, not its ceiling.
Gray, W. M., 1984: Atlantic seasonal hurricane frequency. Part I: El Niño and 30 mb quasi-biennial oscillation influences. Mon. Wea. Rev., 112, 1649-1668. ↩
NOAA Climate Prediction Center, February 2026: adoption of the Relative Oceanic Niño Index for ENSO monitoring and prediction; the circular notes that event labels can shift between indices. The 2026 El Niño characterization is from Colorado State University's August 2026 seasonal forecast; our own phase assignment for 2026 will follow its August-October RONI value once the season is complete. ↩ ↩
Jagger, T. H., and J. B. Elsner, 2006: Climatology models for extreme hurricane winds near the United States. J. Climate, 19, 3220-3236. ↩
Bove, M. C., J. B. Elsner, C. W. Landsea, X. Niu, and J. J. O'Brien, 1998: Effect of El Niño on U.S. landfalling hurricanes, revisited. Bull. Amer. Meteor. Soc., 79, 2477-2482. ↩
Smith, S. R., J. Brolley, J. J. O'Brien, and C. A. Tartaglione, 2007: ENSO's impact on regional U.S. hurricane activity. J. Climate, 20, 1404-1414. ↩
Colbert, A. J., and B. J. Soden, 2012: Climatological variations in North Atlantic tropical cyclone tracks. J. Climate, 25, 657-673. El Niño is associated with a weakening of the subtropical high, an increase in the share of recurving-ocean tracks, and a decrease in recurving-landfall tracks, attributable to steering flow. ↩
Kossin, J. P., S. J. Camargo, and M. Sitkowski, 2010: Climate modulation of North Atlantic hurricane tracks. J. Climate, 23, 3057-3076. Gulf of Mexico storms comprise more than 40 percent of landfalling storms and show no ENSO dependence; the AMM and ENSO most strongly modulate the deep-tropical systems. ↩
Klotzbach, P. J., 2011: El Niño-Southern Oscillation's impact on Atlantic basin hurricanes and U.S. landfalls. J. Climate, 24, 1252-1263. ↩
Smith, S. R., J. Brolley, J. J. O'Brien, and C. A. Tartaglione, 2007: ENSO's impact on regional U.S. hurricane activity. J. Climate, 20, 1404-1414. Regions: East Coast (Florida-Georgia border northward), Florida (whole state), Gulf (Texas to the Florida-Alabama border); JMA index, 1900-2004. ↩
Hall, T., and E. Yonekura, 2013: North American tropical cyclone landfall and SST: A statistical model study. J. Climate, 26, 8422-8439. ↩
The Colorado State University seasonal forecasts derive landfall probabilities from Poisson fits to storms tracking within 50 miles of each landmass over the historical record, scaled by forecast activity; the climatological rate is the denominator. ↩