
Armor Pro Research · Hurricane occurrence climatology
Where Do Hurricanes Make Landfall Most Often in the U.S.? The 2026 Answer
Fifty years of research say the same three places. Here is the answer as it stands on the complete record through the 2025 season, how sure it is, and what the historical odds say about the strong El Niño season now underway.
Ask where hurricanes hit the United States most, and the honest answer is that it depends on what you count, but not on much else. Three stretches of coast come up under every reasonable definition, and they have come up in every study since 1971. This page gives the answer on the record through the 2025 season, and says how sure the ranking is.
The short answer South Florida and the Keys have had the most hurricane-strength coastline crossings and, by a clear margin, the most close passes by major hurricanes. The Outer Banks of North Carolina have had the most hurricanes pass nearby of any strength, because storms that graze, stall offshore, or curve back out to sea all count there. The north-central Gulf Coast, centered on southeast Louisiana, is third under every definition and first if you count from 1851, before the record was reliable. On the crossing count, south Florida and southeast Louisiana are closer than the raw numbers suggest once you allow for how imprecisely early storm positions were recorded, so we call south Florida the most probable leader rather than the winner. The Outer Banks lead on nearby passes with more confidence.
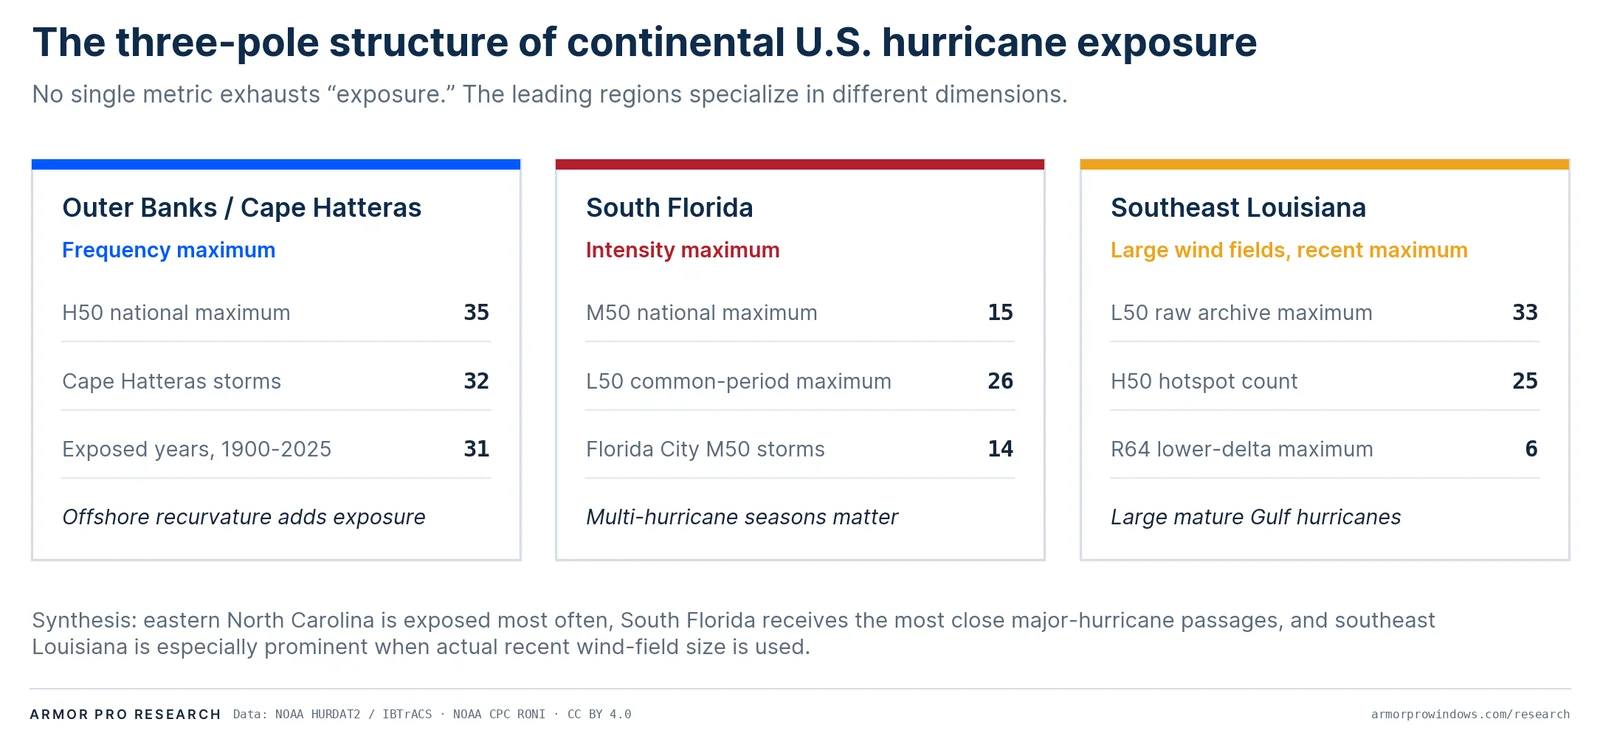
These are historical averages over 126 seasons. They are not schedules, and they are not forecasts for any particular year.
Where hurricanes hit most: landfalls, close passes, and major hurricanes
A hurricane can affect a place three different ways, and each is a different question.
The strictest question is where the center crossed the coastline at hurricane strength. On the record since 1900, the largest concentration of those crossings within 50 nautical miles of a point is in the Florida Bay and Everglades sector of south Florida: 26 storms, one every 4.85 years. Among places where people actually live, Florida City and Homestead each sit within 50 nautical miles of 23 hurricane crossings, one every 5.5 years, more than any other community on the coast. Southeast Louisiana follows with 20, southeastern North Carolina with 18.
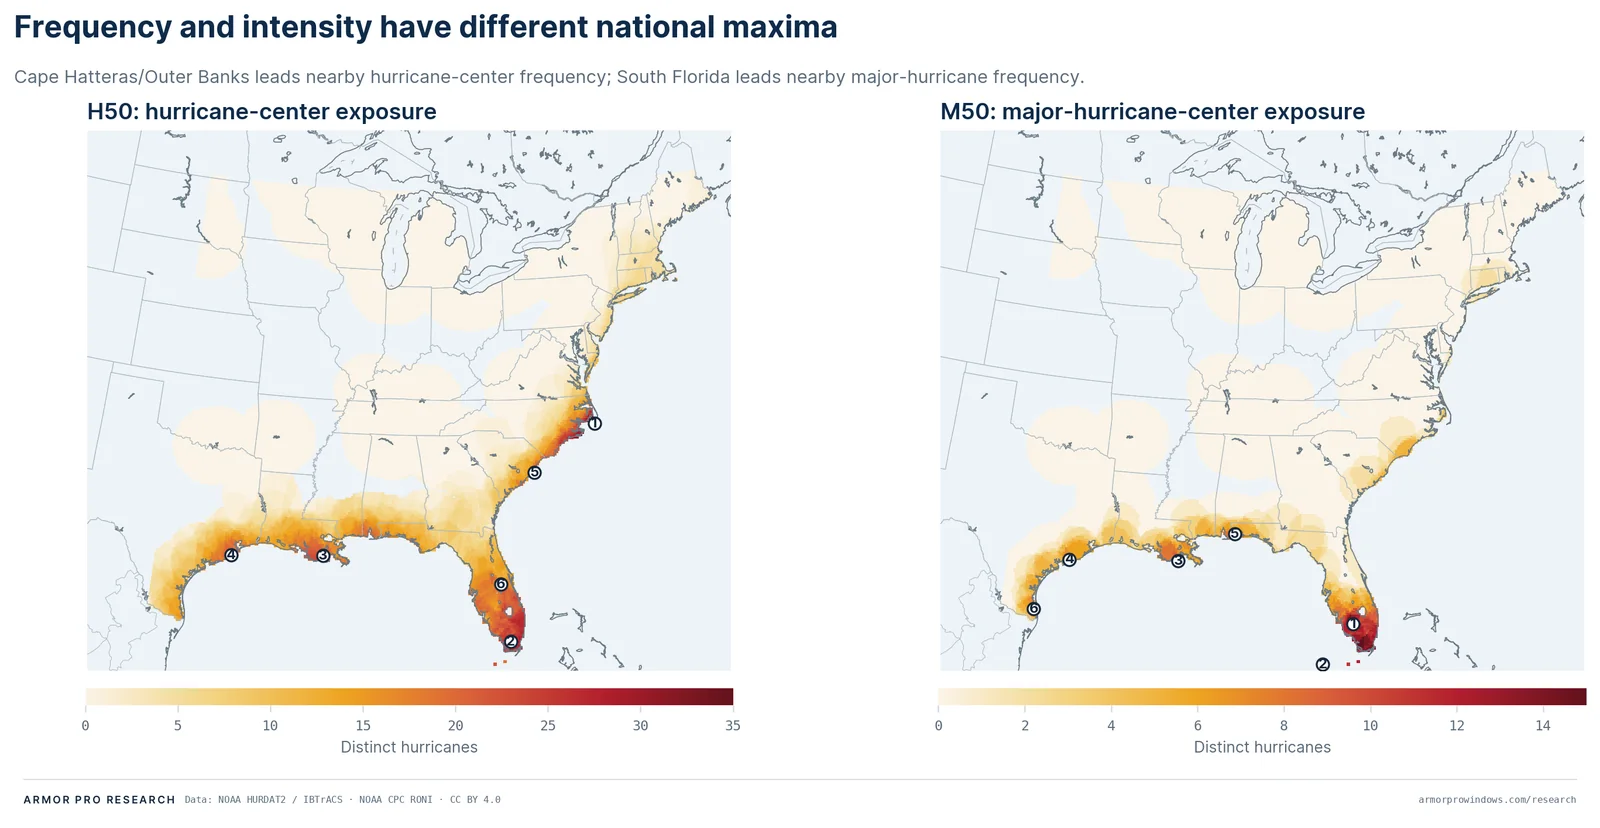
The broader question is where a hurricane passed nearby, whether or not its center touched land. That moves the maximum to Cape Hatteras and the Outer Banks: 35 distinct hurricanes within 50 nautical miles since 1900, one every 3.6 years, with south Florida at 29. The reason is geography. The Outer Banks jut into the Atlantic beside the corridor where storms curve northeast, so a hurricane can make a North Carolina landfall, brush the barrier islands, stay just offshore, or come back out over water after crossing the mainland, and still count. South Florida and Louisiana earn most of their exposure from crossings; the Outer Banks earn an unusual share from storms that never came ashore there.
The narrowest question is where major hurricanes (Category 3 and up) have passed close. That brings the answer back to south Florida: 15 major-hurricane centers within 50 nautical miles of the south and southwest Florida neighborhood that scores highest, one every 8.4 years, with the Dry Tortugas and Keys next at 12. Between them, south and southwest Florida and the Keys hold the major-hurricane maximum in 96 percent of our resamples; where along that stretch the exact peak sits is far less certain than the fact that it is there.
How certain the ranking is
Picking the highest-scoring neighborhood out of tens of thousands of coastal points is not the same as knowing it truly leads. So we tested the ranking two ways: by re-running the whole analysis on thousands of resampled hurricane seasons, and by nudging every recorded landfall position by the amount early records were actually uncertain, which is about 60 nautical miles before 1944, larger than the 50-mile circle itself. (The resampling outputs are on the data page.)
How to read the table: "holds the top spot in resamples" is the share of thousands of re-runs of the analysis, each on a reshuffled set of seasons (and, in the second row, with storm positions jittered), in which that region still came out first. Higher means the lead is more robust; 50 percent would mean a coin flip.
| Question | Most probable leader | Holds the top spot in resamples | Runner-up |
|---|---|---|---|
| Hurricane crossings, seasons resampled | South Florida / Florida Bay | 69% | Southeast Louisiana, 13% |
| Hurricane crossings, seasons resampled and positions perturbed | South Florida / Florida Bay | 45% | Southeast Louisiana, 28% |
| Hurricanes passing nearby | Cape Hatteras / Outer Banks | 63% | South Florida, 28% |
| Major hurricanes passing nearby | South / southwest Florida | 64% | Dry Tortugas / Keys, 32% |
Two things follow. First, the Outer Banks result on nearby passes is reasonably firm. Second, on crossings, south Florida and southeast Louisiana are genuinely close: once the imprecision of old storm positions is admitted, south Florida leads in fewer than half of the replicates, and the count at its best neighborhood is more like 19 or 20 storms than the 26 recorded. We still call south Florida the most probable leader, and for a better reason than any single count: it comes out on top at every search radius we tried, it is simultaneously the clear leader for major hurricanes, and it is where every previous study put the peak. No other region has that combination. But anyone who tells you one town is the most hurricane-prone place in America is quoting a precision the record does not have.
South Florida's multi-hurricane seasons
This is the finding with the most direct meaning for anyone who lives here. A storm counts once per place, but a season can bring more than one, and the two do not line up the same way everywhere.
Cape Hatteras has seen 32 nearby hurricanes since 1900 spread across 31 separate years: almost never two in one season. Miami has seen 28, arriving in only 22 years; Florida City, 28 in 21. When south Florida has a bad season, it has historically been at risk of a second storm in the same season, and the statistics confirm it: south Florida's annual counts are more clustered than a random process would produce, a pattern the published record for Florida has shown before.1 Across the state, in years that had at least one hurricane landfall, roughly four in ten had another.
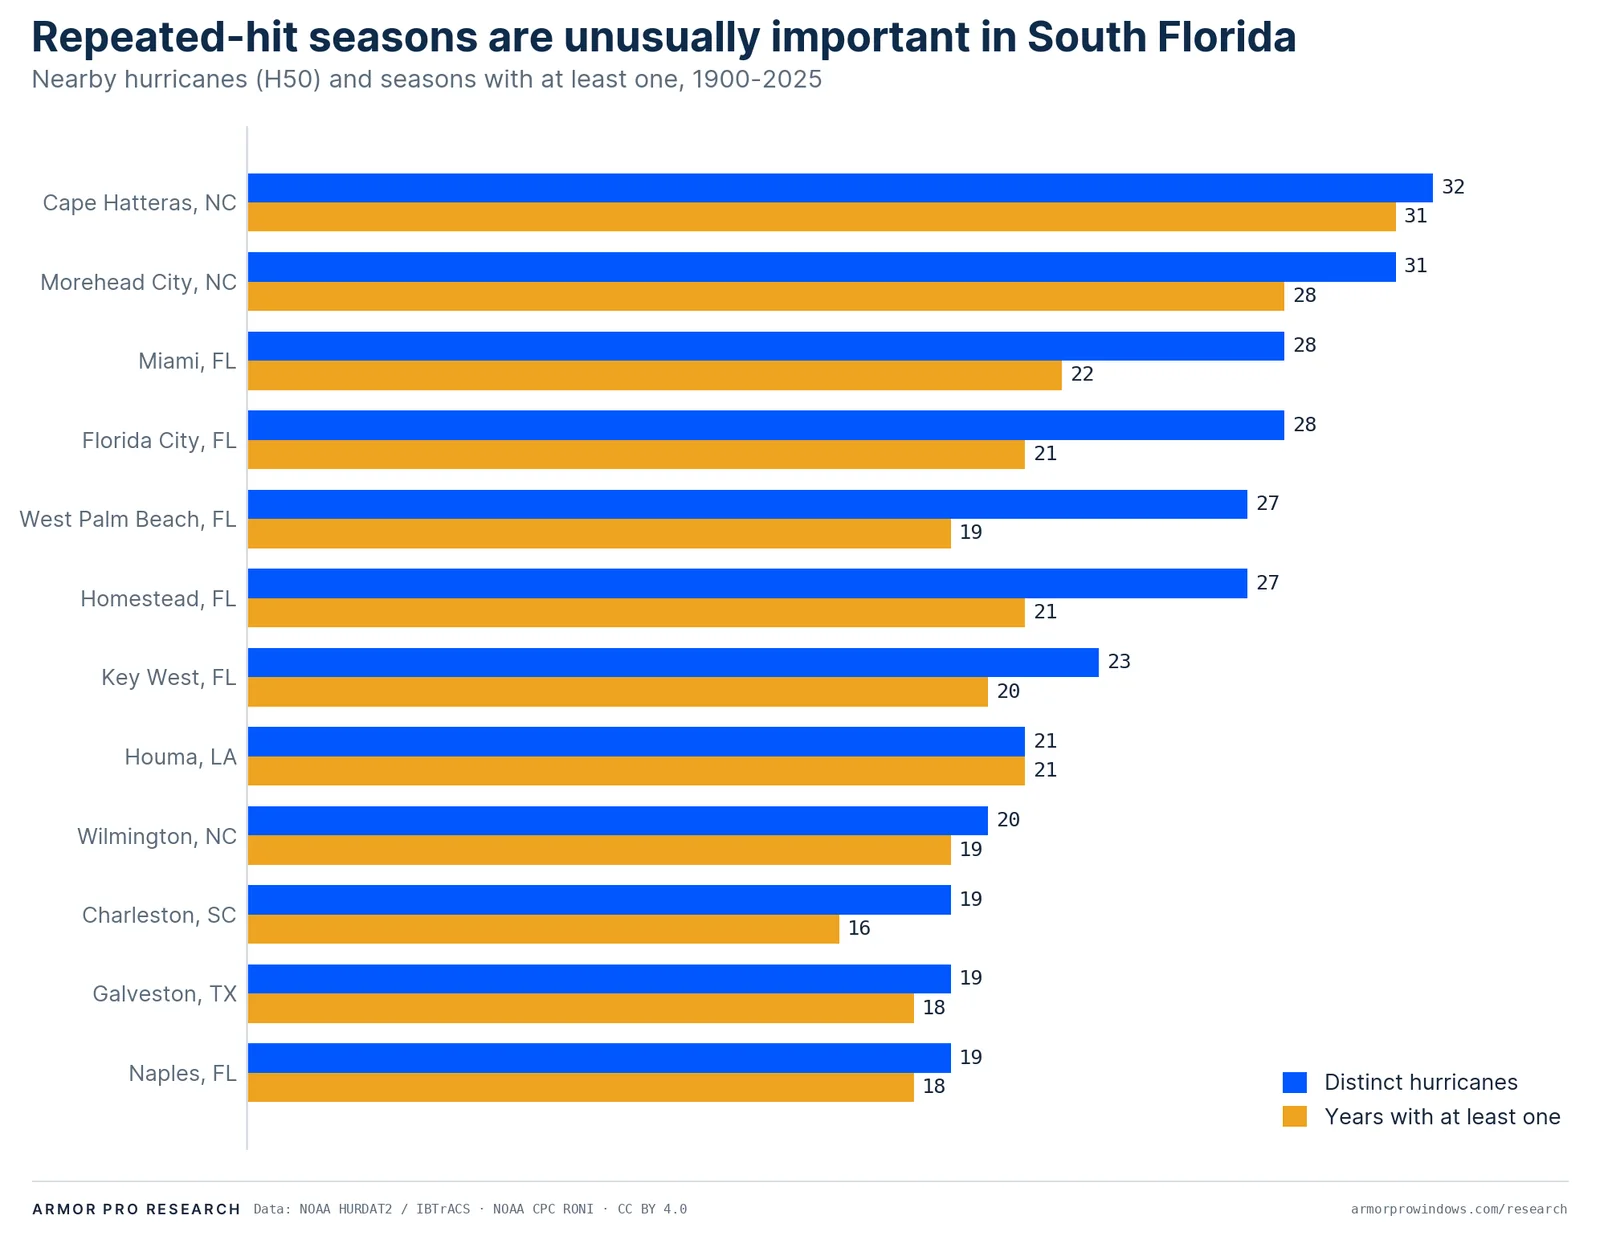
Why it matters is practical, not statistical. A place whose hurricanes come in pairs faces a different planning problem: recovery from one storm can be interrupted by the next inside the same season, and the real demand on evacuation, shelter, insurance, and repair capacity is set by the multi-storm season, not by the average interval between storms. South Florida's "one every five years" understates that demand in a way the Outer Banks' figure does not.
El Niño, La Niña, and the 2026 hurricane season
The Pacific's El Niño-Southern Oscillation shifts the odds for the whole U.S. coast, and as of August 2026 the tropical Pacific is in moderate-to-strong El Niño conditions that forecasters expect to intensify through the peak of the season.2 Sorting the 76 seasons since 1950 by phase (the full analysis is on the ENSO page), El Niño seasons have produced half the rate of hurricane-strength U.S. landfalls of La Niña seasons: 1.0 per season against 2.0, with neutral years in between at 1.6. Put differently, 65 percent of El Niño seasons still had at least one U.S. hurricane landfall, against 85 percent of La Niña seasons, and the chance of a season with two or more was 15 percent against 55.
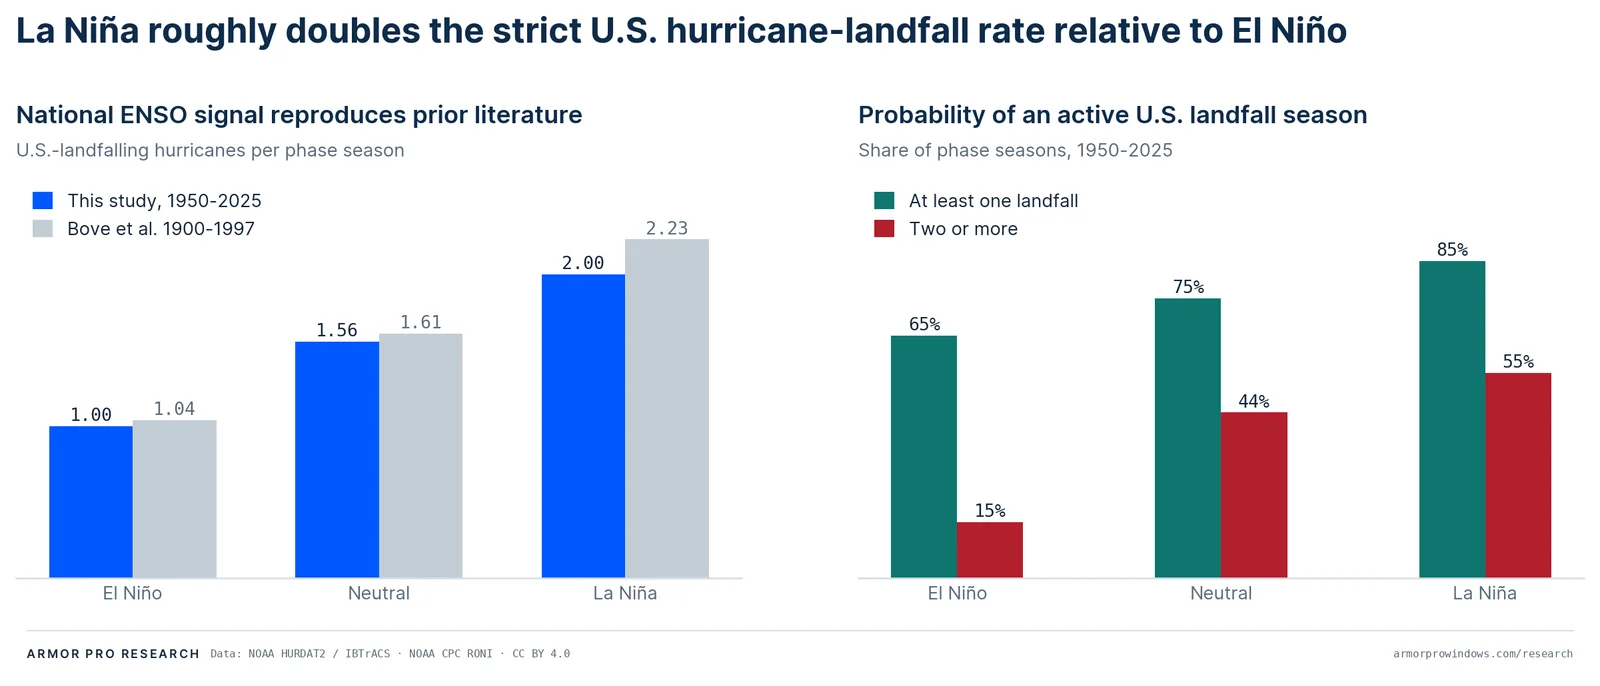
Three cautions travel with that, and the first is the one that matters most in an El Niño year. "Fewer" is a rate, not a promise: two in three El Niño seasons still brought a U.S. hurricane landfall, and 2004, an El Niño season on the index we use, brought Charley, Frances, and Jeanne ashore in Florida within 44 days. It is a national base rate, not a forecast for any coast or any town, and with 20 seasons in each phase the uncertainty is real: the ratio could be anything from about 1.1 to 3.6.3 And it is about how many storms make landfall, not how strong the worst one is; the rarest, most intense landfalling winds have if anything been more likely in El Niño years, not less.4 And ENSO changes how many storms reach the coast, not where along it they arrive: the same three regions lead in every phase, and the modulation is strongest for the long-track Atlantic storms that tend to reach the East Coast and weakest for storms born in the Gulf. La Niña's sharpest concentration in our data is southeastern North Carolina, but that rests on five storms, and we do not read destinations into counts that small.
Fifty years of research on where hurricanes strike the U.S. coast
This is not a new question, and our findings match the existing literature. It has been asked, in one form or another, by government meteorologists, geographers, and statisticians for more than fifty years, and what is striking in hindsight is how little the answer moved while the way of counting kept changing.
| When | Who | How they counted | What they found |
|---|---|---|---|
| 1971 | Simpson & Lawrence, NOAA | Hurricane strikes on 80-km coastal segments, 1886-1970 | Return periods from about 6 years in southeast Florida to 85+ years on sheltered northern coasts |
| 1975 | Ho, Schwerdt & Goodyear, NOAA | Hurricane characteristics at 50 n mi intervals along the coast, 1871-1973; frequencies of storms entering, exiting, and passing within 150 n mi | The first NOAA point-interval climatology of this coast, built for storm-surge frequency work |
| 1987 | Ho and colleagues, NOAA | Update and revision of the 1975 study through 1984, with the entering / exiting / alongshore split | Named the Mississippi Delta, south Florida, Cape Hatteras, and Cape Cod as coastal protrusions that stand apart from their neighbors |
| 1970s-1987, 2011 | Neumann and the NHC; Blake, Landsea & Gibney | The HURISK program, grown from NHC's late-1960s climatology work and documented in a 1987 user manual: return periods fitted to the record within 50 n mi | Cape Hatteras with the shortest hurricane return period of 66 listed communities (5 yr), Miami next (6), Key West 8 |
| 1997, 1999 | Elsner & Kara | Strikes anywhere within each coastal county, 1900-1996; a NOAA memo and the book it previewed | Monroe County (the Keys) most hurricane-prone, once every 4 years; southeast Florida counties the shortest return periods in the country |
| 2007 | Keim, Muller & Stone, J. Climate | Strikes at 45 named beach towns, 1901-2005, using a swath model that reaches farther right of a storm's track than left | "Three focal points": south Florida, the Outer Banks, the north-central Gulf Coast |
| 2026 | This report | Three definitions on a 33,916-point coastal mesh, 1900-2025, with resampling uncertainty on the ranking | The same three regions; south Florida the most probable crossing leader, the Outer Banks the passage leader |
1971: hurricane strikes by coastal segment
One of the earliest published answers came from inside the National Hurricane Center. In 1971 Robert Simpson, co-author of the Saffir-Simpson scale, and Miles Lawrence divided the coast into 80-kilometer segments and counted hurricane strikes on each from 1886 onward. Their return periods ran from about six years in southeast Florida to 85 years or more along Georgia, New Jersey, and New England.5 The method's limitation was the segment: a strike counted for a whole 80-km stretch and for none of its neighbors, so the map was blocky and the answer depended on where the lines fell.
1975 and 1987: NOAA's point-by-point hurricane climatology
NOAA's own point-interval climatology of this coast dates to 1975, when Francis Ho, R. W. Schwerdt, and H. V. Goodyear analyzed hurricane characteristics at 50-nautical-mile intervals along the Gulf and Atlantic coasts for 1871-1973 and tabulated how often storms entered the coast, exited it, or passed within 150 nautical miles.6 Ho and colleagues updated and revised that study in 1987, extending it through 1984 and, in the version most later work draws on, sorting occurrences into storms that came ashore, storms that exited back to sea, and storms that passed alongshore without touching land. That distinction, half a century old, is the same one that separates our crossing count from our nearby-passage count today. The 1987 report also singled out four places, the Mississippi Delta, south Florida, Cape Hatteras, and Cape Cod, as protrusions whose exposure could not be captured by treating the coast as a smooth line.7 Both reports were produced for FEMA's flood-insurance program as inputs to storm-surge studies, which is why they tabulated central pressure, size, and forward speed at each coastal interval as well as frequency.
The National Hurricane Center's return periods (HURISK)
The NHC's own return periods come from HURISK, a statistical program that fits the historical record around each coastal point and returns a smoothed estimate of how often hurricanes and major hurricanes pass within 50 nautical miles. It was not built in one year: the program grew out of NHC's late-1960s work on computer access to the historical record and its analog and climatology forecast models, and Charles Neumann's 1987 technical memorandum is its user manual, written once the program had "become reasonably stable," after an earlier abbreviated description in 1985.8 HURISK's return periods are what NHC publishes today, and its 2011 tabulation for 66 coastal communities gives Cape Hatteras the shortest hurricane return period in the country at five years, with Miami at six and Key West at eight; for major hurricanes Miami's fourteen years is the shortest.9 These are model estimates rather than raw counts, which is why our empirical figures come out about a quarter shorter than NHC's while ranking the places the same way.
1997: hurricane return periods by county
In 1997 James Elsner and Birol Kara, working at Florida State University for NOAA, counted strikes by county for 1900-1996, in a NOAA memo that previewed the county chapter of their 1999 book. Because a county is a much larger target than a point, their return periods are shorter, and it is their work that produced the widely repeated statement that Monroe County, the Florida Keys, is the most hurricane-prone county in the United States, with a hurricane about once every four years, and that southeast Florida's counties have the shortest return periods anywhere in the country.10 The same study noticed something about Florida that we return to below: its hurricanes tend to arrive in clusters, with a second landfall in roughly four of every ten years that had one.
2007: the three focal points of U.S. hurricane activity
The study ours most closely resembles is Barry Keim, Robert Muller, and Gregory Stone's 2007 paper in the Journal of Climate. They chose 45 well-known beach towns from Brownsville, Texas, to Eastport, Maine, and counted strikes over 1901-2005 using a swath model informed by the storm-size literature: because a hurricane's damaging winds reach farther to the right of its track than to the left, they let a storm "strike" a town if it passed 80 km to the right or 40 km to the left, with wider bands for stronger storms. Their conclusion is the one this page opened with: three focal points of activity, south Florida, the Outer Banks of North Carolina, and the north-central Gulf Coast.11 Their map also already showed what we call definition-dependence: the Outer Banks lead when tropical storms are included, tie south Florida for hurricanes, and fall well behind it for major hurricanes.
After 2007: models, simulations, and the updated record
Much of the work since has taken different forms: statistical models that condition landfall counts on climate signals like ENSO, simulations that generate thousands of synthetic storm tracks to estimate hazard, and hierarchical models that let neighboring stretches of coast inform each other.12 Those approaches use a descriptive climatology like this one as a starting point. Meanwhile the record itself has changed: the very active seasons of 2004-05, 2017-22, and 2024 have been added, NOAA has re-analyzed the early record, and its ENSO index has been replaced. We looked for a point-by-point count of the whole coast on this updated record and were not able to find one, which is why we ran ours. Our maps agree with Keim, Muller, and Stone's at every intensity tier, under a different way of counting, on the current record.13
About this report
Our report brings this kind of count up to date on the record through the 2025 season, using NOAA's reanalyzed archive. It evaluates the whole coast at 33,916 points rather than at a fixed list of sites, under three explicit definitions side by side, and it reports how sure the ranking is under two kinds of resampling: re-running the analysis on resampled seasons, and perturbing recorded storm positions by the amount early records were uncertain. It repeats the 1998 ENSO stratification with 28 more seasons and NOAA's current index, and for 2004-2025 counts locations inside each storm's analyzed wind field, where four regions tie and none stands out. The full report states every method, every number with its interval, and every place where our figures differ from NOAA's and why.14 We have tried to place it correctly against the earlier work, and we were not able to find a study that already does what this one does on the current record; if one exists, we would like to hear about it.
Full report: Hurricane Occurrence Along the U.S. Gulf and Atlantic Coasts, 1900-2025 (PDF, 24 pp). Data, code, and every derived table: the data page. Cite as: Armor Pro Windows & Doors (2026). Hurricane Occurrence Along the U.S. Gulf and Atlantic Coasts, 1900-2025. armorprowindows.com/research.
What "within 50 nautical miles" means, and why that radius
Every count on this page asks whether something happened within 50 nautical miles (92.6 km, about 57 statute miles) of a coastal point. That radius is the one the National Hurricane Center uses for its own return-period maps, and NHC justifies it as roughly the average reach of hurricane-force winds. It was fixed before we looked at any results, and every core result was re-checked at 25, 75, and 100 nautical miles; the leaders do not change. A fixed symmetric circle ignores that a hurricane's winds reach farther to the right of its track than the left; earlier studies modeled that asymmetry, and our comparison with them, plus our separate wind-field analysis for the modern era, is how we account for the difference.
Why the record starts in 1900, and what happens if you start earlier
The hurricane record goes back to 1851, but south and southwest Florida were barely settled in the nineteenth century and their storms went largely unrecorded, while Louisiana's record is reliable from about 1880. Counting from 1851 treats those missing Florida years as storm-free and hands the crossing lead to southeast Louisiana, 33 to 30. NOAA's own guidance gives 1900 as the start of the reliable record for the whole U.S. coastline, and every prior point climatology has used it or later; so do we. Independent reconstructions of the early record have added dozens of storms to the open-ocean count while changing the number of U.S. landfalling hurricanes by about one percent, which is why a landfall climatology can stand on this record at all.
How our numbers compare with NOAA's, and why they differ
NHC's published return periods and ours count the same event, hurricanes passing within 50 nautical miles, but theirs are model estimates and ours are raw counts on the current record. Ours come out about 25 percent shorter, consistently, on every window we tested, including the one NHC's model was fitted on. The order of places is the same. We report both and adjust neither: if you need NOAA's modeled figure for a location, use NOAA's; ours is the empirical count. The "Monroe County, once every four years" figure often attributed to the Weather Service comes from a 1997 county-level study that counts strikes anywhere in a county; NHC's figure for the single point of Key West is once every eight years. Both are right about different things.
What this research is not
It measures where hurricane conditions have occurred and how often. It does not combine storm surge, rainfall flooding, the buildings and people present, or how vulnerable they are, and it is not a ranking of risk or danger. A frequently exposed, well-built community can fare better in a given storm than a rarely exposed, vulnerable one. Turning occurrence into risk requires layers this work deliberately keeps separate.
About this research, our interest, and how it was checked
Armor Pro Windows & Doors sells and installs impact-rated windows and doors in South Florida and has a commercial interest in public awareness of hurricane exposure. This report was produced and funded internally. It analyzes NOAA's public hurricane record with published data and open code; no part of it depends on proprietary data, all analytical choices were fixed before results were examined, and the complete pipeline is published so that any result can be checked independently. Agreement with NOAA's products and with the earlier published climatologies was our acceptance standard throughout. Data, figures, and derived tables are released under CC BY 4.0.
The clustering of Florida hurricane seasons was reported by Jagger and Elsner (2012, J. Appl. Meteor. Climatol. 51, 869-877), and the statewide multi-hit statistic by Elsner and Kara (1997, NOAA Tech. Memo. NWS SR-192), whose figures our record reproduces closely. Formally: south Florida's annual counts are overdispersed relative to a Poisson process (variance-to-mean ratio 1.19-1.26). ↩
The 2025 hurricane season, the last in our record, was a La Niña season on NOAA's Relative Oceanic Niño Index (RONI), which the Climate Prediction Center adopted for operational ENSO classification in February 2026. The 2026 season is a different matter: Colorado State University's August 2026 outlook describes moderate-to-strong El Niño conditions in the tropical Pacific and anticipates a strong El Niño for the peak of the season. Our seasons are classified by their August-October value, so 2026's own classification is not final until the season ends. ↩
Rate ratio 2.00 with an exact 95% confidence interval of 1.14 to 3.61. Of the three pairwise phase comparisons, only La Niña versus El Niño excludes a ratio of one. The result updates Bove et al. (1998, Bull. Amer. Meteor. Soc. 79, 2477-2482), whose 1900-1997 rates of 1.04, 1.61, and 2.23 per season we closely reproduce. ↩
Jagger and Elsner (2006, J. Climate 19, 3220-3236). ↩
Simpson, R. H., and M. Lawrence, 1971: Atlantic hurricane frequencies along the United States coastline. NOAA Tech. Memo. NWS SR-58. Their segment return periods are compared with the later county and point studies in Keim et al. (2007), Fig. 6. ↩
Ho, F. P., R. W. Schwerdt, and H. V. Goodyear, 1975: Some climatological characteristics of hurricanes and tropical storms, Gulf and East coasts of the United States. NOAA Tech. Rep. NWS 15, 87 pp. Cumulative probability distributions of hurricane parameters at 50 n mi coastal intervals, and smoothed frequencies of storms entering, exiting, and passing within 150 n mi of the coast. ↩
Ho, F. P., J. C. Su, K. L. Hanevich, R. J. Smith, and F. P. Richards, 1987: Hurricane climatology for the Atlantic and Gulf coasts of the United States. NOAA Tech. Rep. NWS 38. Described by its authors as "an update and revision" of NWS 15. Counts were smoothed along the coast; the four protrusions are named as places that "must be examined on an individual basis." ↩
Neumann, C. J., 1987: The National Hurricane Center Risk Analysis Program (HURISK). NOAA Tech. Memo. NWS NHC-38. The memo's introduction traces the program to Hope and Neumann (1968, 1969) and the HURRAN and CLIPER models, states that a user manual became feasible once the program was "reasonably stable," and cites an earlier abbreviated description in Neumann (1985). ↩
Neumann (1987), as above. Blake, E. S., C. W. Landsea, and E. J. Gibney, 2011: The deadliest, costliest, and most intense United States tropical cyclones from 1851 to 2010. NOAA Tech. Memo. NWS NHC-6, Table 12 and Figs. 5-6, "hurricanes passing within 50 n mi." ↩
Elsner, J. B., and A. B. Kara, 1997: A climatology of hurricanes for the U.S. Gulf and Atlantic coasts. NOAA Tech. Memo. NWS SR-192; and 1999: Hurricanes of the North Atlantic: Climate and Society, Oxford University Press. County figures count direct and indirect strikes anywhere in the county, which is why they are shorter than point figures for the same place: NHC's 50 n mi return period for the single point of Key West is eight years against Monroe County's four. ↩
Keim, B. D., R. A. Muller, and G. W. Stone, 2007: Spatiotemporal patterns and return periods of tropical storm and hurricane strikes from Texas to Maine. J. Climate, 20, 3498-3509. The swath dimensions are their Fig. 3; the three focal points are their abstract and Section 3. ↩
Among many: Jagger, Elsner, and Niu (2001) and Villarini, Vecchi, and Smith (2012) for count models with climate covariates; Hall and Jewson (2007, 2008) for statistical track models and the question of whether local counting is the right approach; Tolwinski-Ward (2015) for the hierarchical treatment; Emanuel et al. (2006) and Bloemendaal et al. (2020) for synthetic-track hazard. Colorado State University's seasonal forecasts derive their landfall probabilities from exactly the kind of within-50-mile historical rate this report computes. ↩
Computed at Keim et al.'s 45 sites over their own 1901-2005 window: rank correlation 0.84-0.88 (Spearman) at every intensity tier, with our symmetric-circle intervals shorter than their asymmetric-swath values by a factor the two geometries predict (median 0.90, 0.70, 0.60 for tropical-storm-and-stronger, hurricanes, and majors). ↩
Report sections 4.2 (comparison with the earlier climatologies and NHC), 3.4 (statistics), and the Data Availability statement. ↩