
Armor Pro Research · Research note
Reproducing CSU's New AI Guidance for the 2026 Hurricane Season
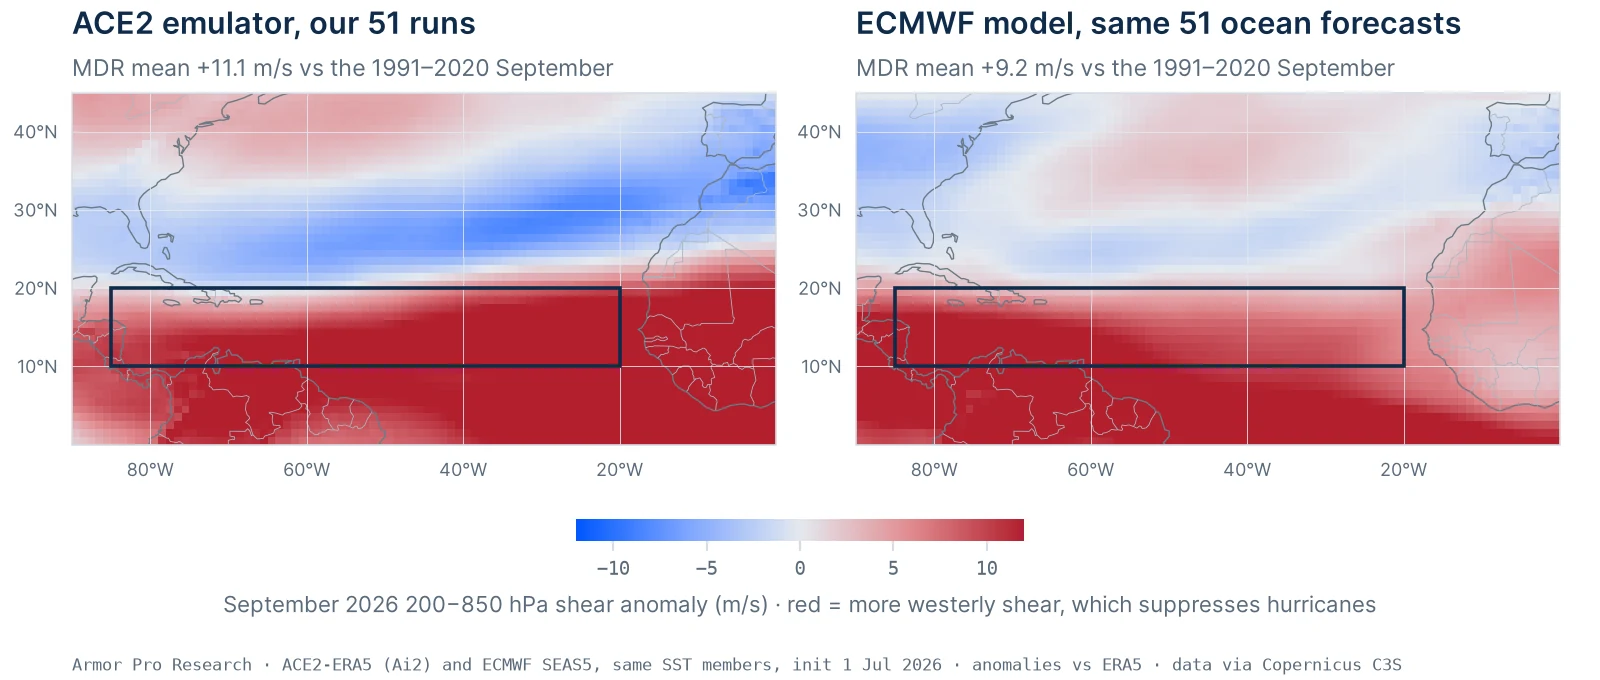
This year Colorado State added an AI climate emulator to the guidance behind its seasonal hurricane forecast. We ran the same public model on the same public inputs, put the answer next to ECMWF's own model and next to what the atmosphere has done so far, and found they agreed directionally.
Colorado State University's 2026 seasonal hurricane forecasts use the Ai2 Climate Emulator, ACE2, an AI weather-and-climate model, as guidance. This note began from an investigation into Figures 12 and 13 of the August 5 forecast: the September ensemble-mean vertical wind shear anomaly over the tropical Atlantic, from ECMWF's seasonal model and from ACE2 respectively. Because the model and its inputs are public, we were able to re-run it; we then asked three further questions: does it get past Septembers right, what is the spread behind the ensemble mean, and how large is the anomaly it predicts?
The result The direction reproduces without qualification: all 102 members across two ECMWF initializations put September 2026 shear over the main development region above normal, in the same pattern as CSU's map. The size is where the interest lies. The emulator's ensemble mean is +11.5 m/s against its own 1991–2020 climatology (median +11.8, member spread 2.6), roughly double the largest September in the ERA5 reanalysis since 1991 (+6.1, in 1991). ECMWF's own seasonal model, forced by the same 51 ocean forecasts, says +9.2 m/s on the same reanalysis baseline (+7.0 against its own hindcasts, the highest in that hindcast period), so the emulator sits about one-fifth above the physics-based model, which is also how far its own hindcast runs above the reanalysis for El Niño years. And indeed, the atmosphere is on that trajectory: July 2026 was the most-sheared July over the main development region since 1991 (+7.4 m/s), and August 1–12 ran at +5.8, inside the emulator's ensemble for that window. September verifies in early October.
This is a reproducibility exercise on public inputs, not a forecast product, and nothing in it concerns landfall. The emulator's own model card says its outputs "should not be used for operational climate predictions,"1 and at one-degree resolution it does not resolve hurricanes at all. What it does resolve is the September shear environment, which is exactly what CSU used it for and what this note is about.
The setup
CSU's August report names the model, the forcing, and the quantity: ACE2-ERA5, the version of Ai2's emulator trained on the ERA5 reanalysis and described by Watt-Meyer and colleagues in 2025,2 forced with "the 51 members comprising the ECMWF ensemble prediction of SSTs through September 2026," summarized as the September ensemble-mean 200−850 hPa shear anomaly with the main development region drawn as a blue box (Figure 13 of the report; the July report carries a corresponding figure).34 Our run uses those same three elements. The rest of our configuration is listed here for reproducibility.
| Element | This reproduction |
|---|---|
| Model | The public ACE2-ERA5 checkpoint (Hugging Face allenai/ACE2-ERA5), run with Ai2's fme code |
| Ocean forcing | ECMWF SEAS5 (system 51), 1 July 2026 initialization, 51 members, daily SST and sea ice from the Copernicus Climate Data Store, interpolated to six-hourly and regridded to the model's grid; a second set from the 1 August run |
| Initial atmosphere | An ERA5 state from 1 July 2020 relabeled 1 July 2026, with ocean temperatures overwritten from the member (Ai2's own practice for out-of-sample runs); the atmosphere forgets it within weeks |
| Integration | 1 July to 1 November, six-hour steps, monthly means saved |
| Shear | ACE2 has eight terrain-following layers, not pressure levels; we use layer 2 (144–254 hPa) minus layer 6 (778–916 hPa). Its September climatology over the box, 6.0 ± 3.9 m/s, sits next to ERA5's true level shear, 6.4 ± 3.2 |
| Anomaly baseline | The emulator's own 1991–2020 climatology: 30 additional runs forced with the observed ERA5 oceans of each year (model-consistent), with ERA5 itself as the cross-check |
| Ensemble | The mean, every member, and the same 51 members through ECMWF's own model |
Everything below the table is computed from the runs; the tables and scripts are on the data and code page.
First: does the emulator get past Septembers right?
Before asking a model about 2026 it is worth asking what it does with years whose answer is known. The 30 climatology runs are that test. Each is the emulator forced with the ocean temperatures that actually occurred, so its September shear over the main development region can be laid against the reanalysis year by year, and against ENSO.
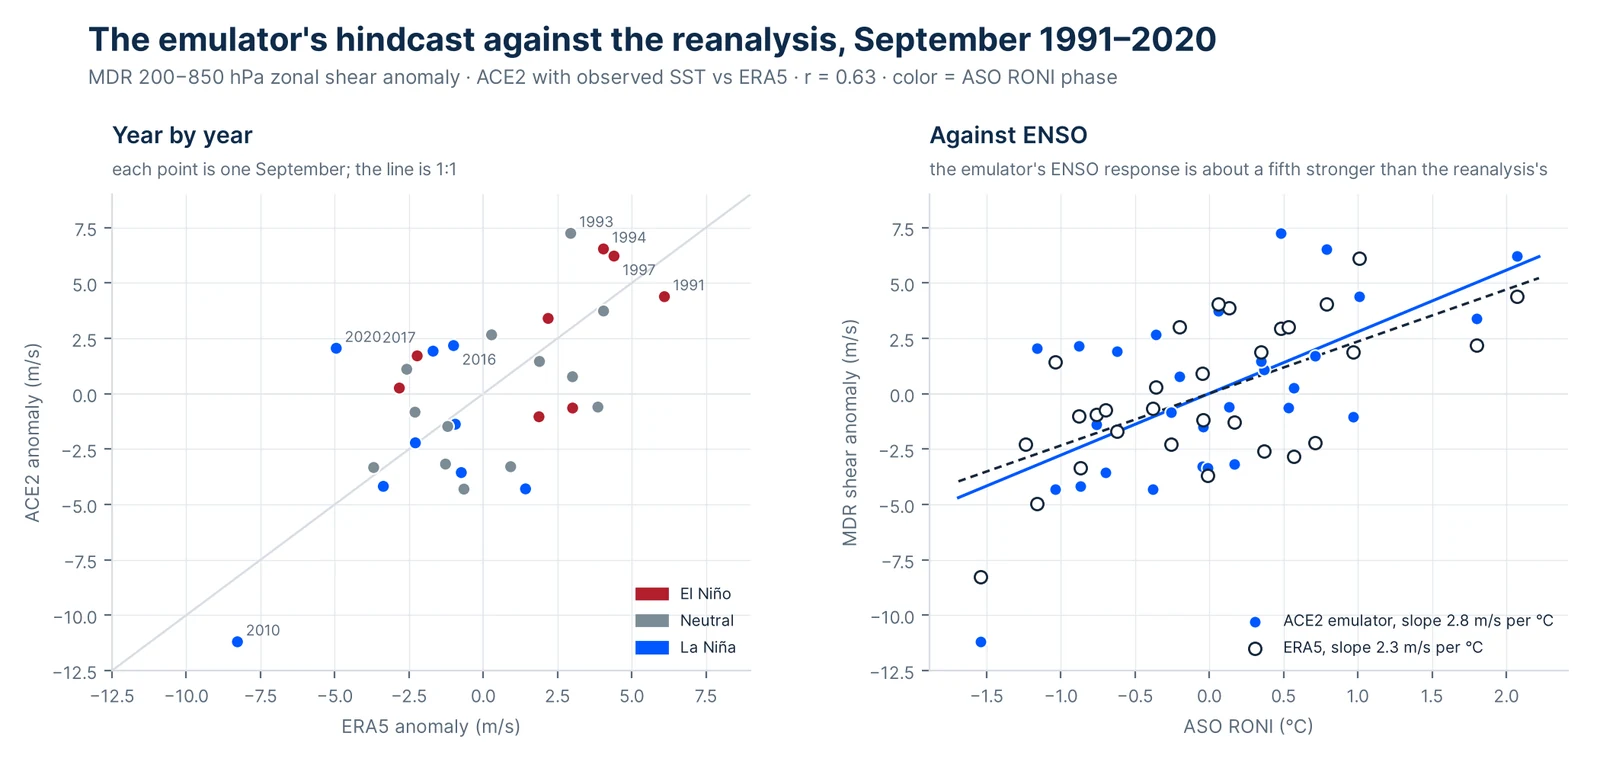
It gets the physics right and the amplitude a little strong. The correlation between the emulator's Septembers and ERA5's is 0.63, the same as ERA5's own correlation with ENSO. The phase means are the ones Gray described in 1984:5 El Niño Septembers average 8.6 m/s of shear over the box in the emulator, La Niña 3.7, neutral 6.0. The extremes are the right years, 1993, 1994 and 1997 at the top, 2010 at the bottom (−11.2, against −8.3 in ERA5). Its response to ENSO is about a fifth stronger than the reanalysis's, 2.8 against 2.3 m/s per degree of the index, and its year-to-year spread is correspondingly wider, 3.9 against 3.2 m/s.
The misses seem to be as informative as the hits. In 2016, 2017 and 2020, all La Niña Septembers in reality below normal (−1.0, −1.7, −4.9), the emulator produced above-normal shear (+2.2, +1.9, +2.1). A regression of both series on the ocean-temperature indices explains why: the reanalysis shows tropical-mean warmth reducing shear over the box (−4.4 ± 1.8 m/s per °C, on the 30 years), while the emulator shows no such effect (+1.6 ± 3.0). Both share the strongest control in the data, the Atlantic's temperature relative to the rest of the tropics, at about −7 m/s per °C: a relatively cool Atlantic means more shear, the relative-SST idea Vecchi and Soden put on a firm footing in 2007.6 A 2022 run added as a check (La Niña, relatively warm Atlantic) came out at −3.0 against ERA5's −3.9. So: direction and mechanism reliable; amplitude a fifth high; and something the reanalysis does with tropical warmth that the emulator does not.
What the emulator says about September 2026
Forced with the 51 ECMWF ocean forecasts of 1 July, the emulator's September ensemble mean over the main development region is +11.5 m/s of zonal shear against its own climatology (+11.1 against ERA5's), median +11.8, member standard deviation 2.6, the lowest member +3.5 and the highest +14.8. All 51 members are positive; 48 exceed +8. The vector shear says the same (+9.9), as does the western box CSU uses as a predictor (+9.8). The signal builds through the season: +4.6 in July, +10.3 in August, +11.5 in September, +7.2 in October, and every member is positive in every month. Forced instead with the 1 August ocean forecasts, the same procedure gives +10.5 (51 of 51 positive, 44 above +8): the guidance did not move between CSU's July input and the newer run.
For scale, the emulator's own most-sheared September in thirty hindcast years was +7.2 (1993). ERA5's, since 1991, is +6.1. Every September from 2021 to 2025 was below normal in ERA5, including 2023's El Niño (−2.4), the year a record-warm Atlantic offset the Pacific.
What we checked before believing the number
Four things could have manufactured an anomaly this large without physics behind it. Each was tested and cleared. The baseline: ERA5's own September climatology over the box (6.4 m/s) is within 0.4 of the emulator's (6.0), so the anomaly is +11.1 either way. The ocean input: the regridded SEAS5 field correlates at 0.991 with ERA5's pattern on the initialization day (a latitude flip or longitude shift scores far lower), and its Niño-region values match the anomalies CSU tabulates for July. The initial atmosphere: three members re-run from a 2001 state instead of 2020 gave September anomalies of +13.0, +6.6 and +14.1 against +10.3, +4.1 and +14.4 from the same members with the 2020 state, differences inside the member spread; only July, which still remembers the initial state, moved systematically. The absolute warmth: the 2026 ocean forecast is 1.4 °C warmer across the tropics than the 1991–2020 forcing, outside anything in the hindcast (its maximum is +0.5). Three members re-run with a uniform 1.39 °C removed from every ocean point, leaving the pattern intact, gave +14.4, +9.9 and +9.3, against +10.3, +4.1 and +14.4 with the true temperatures: no reduction. The response is to the ocean's pattern, a relative Niño-3.4 warmth of +2.1 °C (beyond 1997's +1.9) with an Atlantic 0.6 °C cooler than the tropical mean, not to the absolute level.
Two of our own choices remain untested for sensitivity: the mapping of the emulator's layers to 200 and 850 hPa (only the two layers used were saved), and using the SEAS5 ocean forecasts as issued rather than bias-corrected.
The same question put to ECMWF's own model
The reference the reproduction needed most was not another emulator run but the physics-based model that produced the ocean forecasts in the first place. ECMWF's SEAS5 forecasts its own atmosphere alongside those SSTs, and its monthly 200 and 850 hPa winds are on the same Copernicus data store, member by member.7 Its September 2026 shear anomaly over the main development region, against the same ERA5 baseline, is +9.2 m/s (member spread 2.0, all 51 members positive, 49 above +6). Against its own 1993–2016 hindcasts, which is how ECMWF's forecasters would read it, the anomaly is +7.0, higher than the ensemble mean of any hindcast year (the previous maximum was +5.8), which is the "highest since 1981" that CSU and others have reported from the operational charts.8 Its August is +6.9 and its October +5.7.
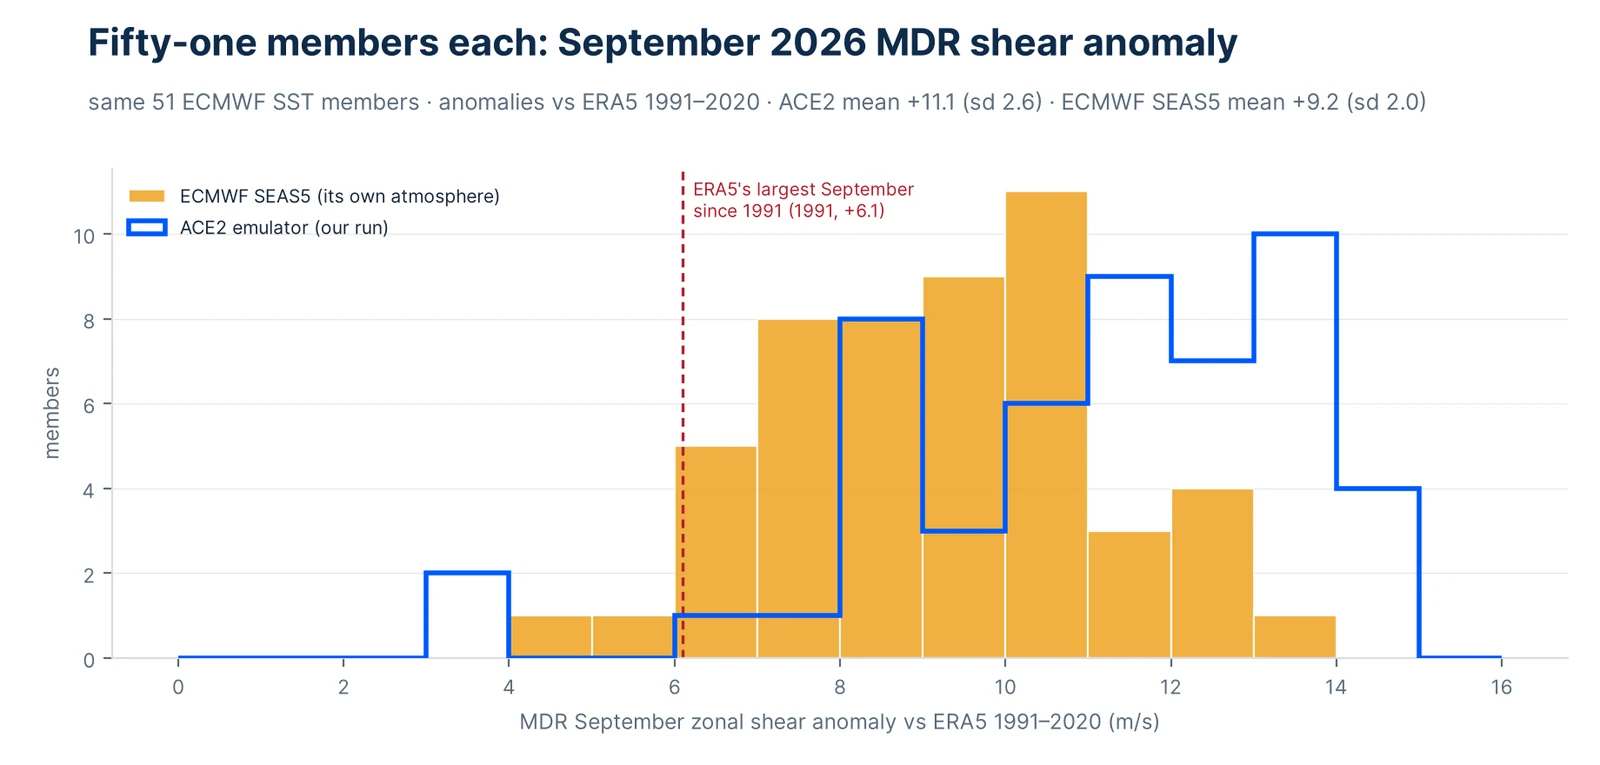
So the two models, given identical oceans, disagree by about a fifth (11.1 against 9.2 on the common baseline), and the disagreement has the sign and size the hindcast predicted: the emulator's ENSO response is about a fifth stronger than the reanalysis's, and 2026 is, in ECMWF's oceans, an El Niño beyond 1997 in relative terms. Member by member the two hardly correlate (0.15), which is expected: the ocean members differ little from one another, so the differences between members are the atmosphere's own variability, different in each model. The comparison is between the two ensemble means, and both say record.
What has happened so far
Two of the four months in the runs are now partly observed, and ERA5's preliminary product carries them.9
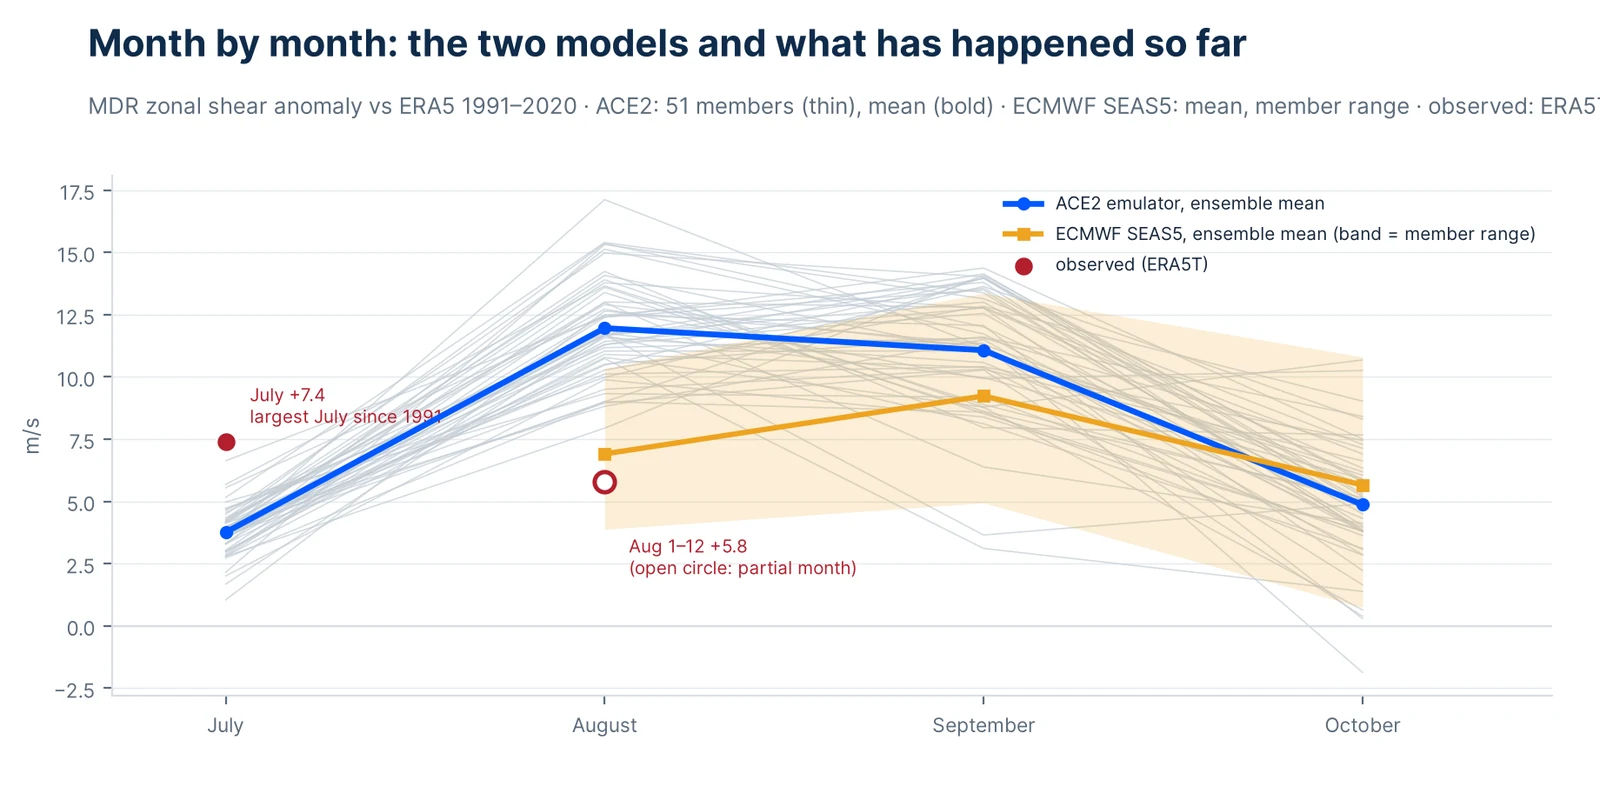
July 2026 was the most-sheared July over the main development region in the reanalysis since 1991, +7.4 m/s, above 2015's +6.5, and already above the September record. CSU's August report notes the same from a different series, the western box's 30-day shear ending 29 July at 41.2 knots, second only to 2015.3 The emulator's July, which still carries the memory of the borrowed initial state, was lower (+4.6 ± 1.0). August 1–12 ran at +5.8, above the largest full August since 1991 (+4.7, in 2002); the emulator's members for the same twelve days average +7.3 with a spread of 3.0, and the observation sits fifteenth of fifty-two, inside the ensemble. ECMWF's August is +6.9. Both models and the atmosphere are, so far, in the same place: a record-level shear season, with the models a little above the observations.
What this does not say
It does not say anything about landfall. Shear over the main development region is one of the environmental controls on how many storms form and survive; it says nothing about where the survivors go, and 2004, 2023 and other El Niño seasons put hurricanes on the Florida coast under above-normal shear. The company's own ENSO analysis is the place for what El Niño seasons have historically meant at the coast; this note is about one input to that season, reproduced.
It is not a forecast product. The emulator's developers say so, and this note agrees: it is an exercise in reproducing a piece of published guidance, and its most useful outputs are the ensemble spread and the calibration.
It is layer shear from a model with eight layers, compared with level shear from a reanalysis with 137. That the two climatologies agree to 0.4 m/s over the box is reassuring, but it does not make them the same quantity.
Data, code, and how to rerun it
You may find the scripts on the data and code page. Contains modified Copernicus Climate Change Service information 2026 (ECMWF SEAS5 forecasts and hindcasts, ERA5 and ERA5T reanalysis); the ACE2-ERA5 checkpoint and code are Ai2's, released under Apache 2.0; CO₂ from NOAA's Global Monitoring Laboratory. Neither ECMWF nor Ai2 nor CSU is responsible for anything here.
Ai2, 2025: ACE2-ERA5 model card, huggingface.co/allenai/ACE2-ERA5; code github.com/ai2cm/ace. ↩
Watt-Meyer, O., et al., 2025: ACE2: accurately learning subseasonal to decadal atmospheric variability and forced responses. npj Climate and Atmospheric Science, 8, 205. doi:10.1038/s41612-025-01090-0 ↩
Klotzbach, P. J., et al., 2026: Forecast of Atlantic Hurricane Activity for 2026, Colorado State University, 5 August 2026, §2.3 "Artificial Intelligence Model Scheme" and Fig. 13; observed shear, Fig. 35. tropical.colostate.edu/Forecast/2026-08.pdf ↩ ↩
Klotzbach, P. J., et al., 2026: Forecast of Atlantic Hurricane Activity for 2026, Colorado State University, 9 July 2026, §2.3 and Figs. 11–12. tropical.colostate.edu/Forecast/2026-07.pdf ↩
Gray, W. M., 1984: Atlantic seasonal hurricane frequency. Part I: El Niño and 30 mb quasi-biennial oscillation influences. Mon. Wea. Rev., 112, 1649–1668. ↩
Vecchi, G. A., and B. J. Soden, 2007: Effect of remote sea surface temperature change on tropical cyclone potential intensity. Nature, 450, 1066–1070. ↩
Johnson, S. J., et al., 2019: SEAS5: the new ECMWF seasonal forecast system. Geosci. Model Dev., 12, 1087–1117. Data: Copernicus Climate Change Service, Seasonal forecast daily and subdaily data on single levels and Seasonal forecast monthly statistics on pressure levels, ECMWF system 51. ↩
Lowry, M., 5 August 2026: "Colorado State University experts release final predictions for the 2026 hurricane season," Eye on the Tropics. michaelrlowry.substack.com ↩
Hersbach, H., et al., 2020: The ERA5 global reanalysis. Q. J. R. Meteorol. Soc., 146, 1999–2049. July 2026 monthly means and August 2026 six-hourly fields are the preliminary ERA5T release. ↩